
Opinion
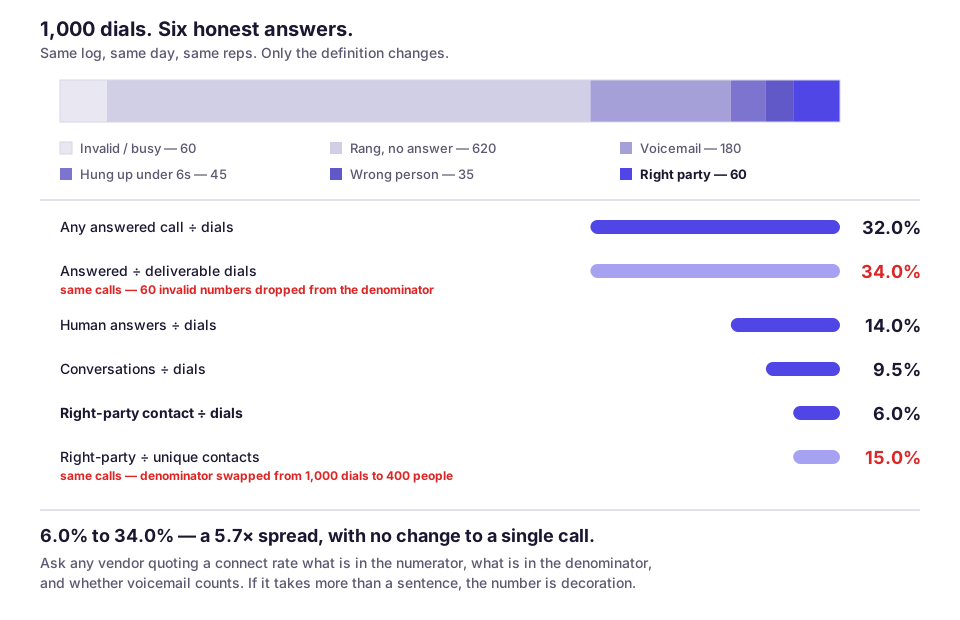
The same 1,000 calls produced six different “connect rates”
- 7 min read
By Sujan ThapaliyaLast updated
The short answer
Two vendors will quote you connect rates in the same pitch deck and neither will define the term. A board deck will show it trending up while pipeline is flat and nobody in the room will ask what changed in the denominator. It is the most-quoted number in outbound calling and it is the least specified.
So here is one call log, scored every legitimate way, with the arithmetic in the open.
The log
A thousand dials against a US B2B list on a normal Tuesday. Every category below comes from something a telephony platform can actually observe: SIP response codes, answering-machine detection, call duration, and a disposition the rep sets. No estimates.
| Outcome | Calls | How it is detected |
|---|---|---|
| Invalid, busy, or disconnected | 60 | SIP 4xx/5xx before ringing |
| Rang, nobody answered | 620 | No answer signal before timeout |
| Answered by voicemail or a machine | 180 | Answering-machine detection |
| Answered by a human, hung up under 6s | 45 | Answer signal, short duration |
| Human conversation, wrong person or gatekeeper | 35 | Rep disposition |
| Human conversation with the intended contact | 60 | Rep disposition |
| Total | 1,000 |
Six defensible numbers from one log
Each of these is a definition somebody in this industry uses in earnest and will defend in a meeting. None of them is a lie. That is the problem.
| Definition | Arithmetic | Result |
|---|---|---|
| Answered signal ÷ dials | (180 + 45 + 35 + 60) ÷ 1,000 | 32.0% |
| Answered ÷ deliverable dials (invalids removed) | 320 ÷ 940 | 34.0% |
| Human answers ÷ dials (voicemail removed) | 140 ÷ 1,000 | 14.0% |
| Conversations ÷ dials (short hang-ups removed) | 95 ÷ 1,000 | 9.5% |
| Right-party contact ÷ dials | 60 ÷ 1,000 | 6.0% |
| Right-party contact ÷ unique people dialed (400) | 60 ÷ 400 | 15.0% |
6.0%
Lowest honest reading of this log
34.0%
Highest honest reading of the same log
5.7×
Spread available with zero change to performance
A 5.7× improvement is available to any vendor, any quarter, without touching a single call. It is a spreadsheet change.
The two levers are the numerator and the denominator, and both are unregulated. Move voicemail into the numerator and the rate roughly doubles. Strip invalid numbers out of the denominator and it lifts again. Switch from dials to unique contacts and it lifts a third time. Do all three and you have a case study.
Which line items get quietly reclassified
Once you know the levers, the specific tricks are predictable, and they show up in benchmark reports far more often than in anyone's own dashboard.
- Voicemail counted as a connect. Technically the call was answered, by a machine that will never call you back. This single choice is worth roughly double on most B2B lists.
- Invalid numbers removed from the denominator. Defensible on its own terms, and it conveniently rewards a dirty list: the worse your data, the bigger the lift when you exclude it.
- Sub-6-second calls kept in. A pickup-and-hang-up is a rejection with extra steps, and it is the most common human outcome on a cold list.
- Unique contacts as the denominator. Reasonable for a multi-touch cadence, and it means every extra attempt at the same person improves the rate rather than diluting it.
- Answering-machine detection turned off. No machine detection means no machine category, which means every voicemail lands in the human bucket by default.
The question that settles it in one line
Why this survives, and it is not only vendors
It would be neater if this were purely vendor dishonesty. It is not. Every layer of the reporting chain is rewarded for the same distortion, which is why the definition drifts upward on its own without anyone deciding to move it.
| Who | What they want the number to show | What they lose by tightening it |
|---|---|---|
| The vendor | Their dialer improves connect rates | The headline claim in the deck |
| The agency | The campaign is working | Renewal leverage |
| The SDR manager | The team is productive | An uncomfortable pipeline conversation |
| The rep | Activity targets met | Their number against quota |
| The CMO | A clean slide | Nothing, which is why they never ask |
A metric nobody in the reporting chain wants to be lower is not a metric. It is a mood.
This is also why connect rate drifts up over a year while meetings booked stays flat. Nobody falsified anything. The definition simply relaxed a little at each hand-off, in the direction everyone preferred.
What to measure instead
You do not fix this by finding the one true connect rate. You fix it by measuring things whose definition cannot slide, and by writing your own definitions down before you start looking at the numbers.
- 1
Write the definitions down first, in one place
One sentence each for dial, answer, conversation, and right-party contact, with voicemail explicitly in or out. Put it in the same document as the dashboard. A definition that lives only in a query gets changed by whoever edits the query. - 2
Report right-party contacts per hour worked
The denominator is hours, which nobody can reclassify, and the numerator is a human conversation with the person you meant to reach. It moves only when the list, the timing, or the dialing improves. - 3
Track cost per right-party conversation
Total spend (licences, minutes, numbers, data) over right-party contacts. It catches the failure mode where a dialing mode lifts volume and destroys quality, which every rate-based metric hides. - 4
Break every rate out by number
One damaged number can drag a whole team's aggregate down while every other number is fine. Per-number answer rate is where deliverability problems actually show up first; see number reputation management. - 5
Keep a fixed control segment
Hold a slice of the list on unchanged settings. When a rate moves, the control tells you whether the change came from the campaign or from the market, or from the reporting.
The honest benchmark
The uncomfortable part
If you tighten your definitions this quarter, your connect rate will fall. It will fall a lot, plausibly from something in the thirties to something around six. Nothing about your team's performance will have changed.
That drop is the most valuable reporting change most outbound teams can make, and it is the one that is hardest to survive politically, because the number that goes down is the number someone already put on a slide. Which is precisely why it has not happened yet at most companies, and why the ones that do it stop confusing a busy dialer with a working one.
Frequently asked questions
What is the difference between connect rate and contact rate?
What is a good connect rate for cold calling?
Does voicemail count as a connect?
Which outbound calling metric is hardest to game?
Why did our connect rate improve while meetings booked stayed flat?
Sources
- Combating Spoofed Robocalls with Caller ID Authentication — Federal Communications CommissionThe STIR/SHAKEN framework, the attestation levels carriers sign calls with, and the mandate requiring providers to authenticate caller ID.
- 47 U.S.C. § 227 — Restrictions on the use of telephone equipment — Cornell Legal Information InstituteThe Telephone Consumer Protection Act itself — the consent requirements, calling-hours limits, and private right of action.
- ITU-T Recommendation E.164 — The international public telecommunication numbering plan — International Telecommunication UnionThe international number format, the 15-digit maximum, and how country codes and national numbers compose.
See it working: call tracking
Call tracking assigns unique phone numbers to marketing sources, or swaps the number on your website per visitor, so every inbound call is attributed to the campaign, keyword, or ad that produced it. It closes the loop between ad spend and actual phone conversations.
- No subscription
- Numbers in 100+ countries
- Compliance built in